
Each score is graded separately against North Carolina schools. A school can be strong at moving students forward (growth) without having the highest test scores, or the reverse. How we score schools
What Goes Into This Rating
| Factor | Weight | Score | Basis |
|---|---|---|---|
| 📚 Achievement (reading & math, grades 3–8) | 40% | 82/100 | 0.8 grade levels above the national average, 2022–25 (Stanford SEDA) |
| 📈 Growth (how fast students learn) | 45% | 42/100 | Students gain 0.70 grade levels per school year in 2022–25 (national average ≈ 1.0) and gained 1.22 in 2009–19; 20th percentile in North Carolina (recent period weighted 70%) |
| 🏫 Resources (class size, funding, size, type) | 15% | 85/100 | Inputs from NCES school and district data |
Students served: 67% students eligible for free or reduced-price lunch. Compared with North Carolina schools serving a similar share of low-income students, this school’s reading and math results are +22 points better than expected. (Context only; not part of the score.)
The overall Repit Score ranks this blend against every rated school in North Carolina. Schools are compared within their state because each state sets its own tests and proficiency bar. How we rate schools
Test Scores & Graduation
| 📖 Reading proficiency | 57% (+11 pts vs. state avg 46%) Students scoring proficient on the state test, 2020–21 |
| ➗ Math proficiency | 57% (+15 pts vs. state avg 42%) Students scoring proficient on the state test, 2020–21 |
Source: U.S. Department of Education EDFacts via the Urban Institute Education Data Portal. Federal reporting rounds small schools to ranges; we show the midpoint. Proficiency standards differ by state, so compare schools within the same state.
How Student Groups Do Here
Share of each group of students scoring proficient on the North Carolina state test (2020–21), compared with the same group of students across the state. Differences between groups are shown as reported; they reflect many factors inside and outside school.
| Students | Reading | Math | vs. same group statewide | Rank in state for this group |
|---|---|---|---|---|
| White | 57% | 62% | reading -1 pts, math +4 pts | 62nd percentile (list) |
| Black | 25% | 25% | reading -1 pts, math +5 pts | 56th percentile (list) |
| Hispanic | 35% | 25% | reading +6 pts, math -5 pts | 43rd percentile (list) |
| Asian | 95% | 95% | reading +20 pts, math +14 pts | 98th percentile (list) |
| Low-income | 32% | 32% | reading +4 pts, math +7 pts | 64th percentile (list) |
Source: U.S. Department of Education EDFacts via the Urban Institute. Groups with fewer than 20 tested students are not shown. Results are achievement (proficiency), not growth; growth by group is not published for individual schools.
School Information
| Address | 61 Spring St NW |
| City | Concord |
| ZIP Code | 28025 |
| District | 3700530 |
| NCES School ID | 370053000376 |
| Data Year | 2024-25 |
Community Context for 28025
Understanding the community around Coltrane-Webb Elementary helps evaluate the school environment and neighborhood.
💰 Income & Economy
| Median Household Income | $70,595 |
| Per Capita Income | $36,012 |
| Poverty Rate | 9.3% |
| Households Earning $100K+ | 33.3% |
🎓 Education Level
| Bachelor's Degree or Higher | 30.8% |
| High School or Higher | 91.6% |
🏠 Housing
| Median Home Value | $232,800 |
| Median Rent | $1,128 |
| Owner-Occupied | 72.2% |
| Renter-Occupied | 27.8% |
Thinking about moving into this school’s area? See what homes and rents actually cost in ZIP 28025 — values, rent, and how it compares to nearby ZIPs. Free, no signup. See 28025 housing costs →
Student Demographics
Enrollment and demographic breakdown for Coltrane-Webb Elementary.
👫 Gender Distribution
🌎 Race & Ethnicity
📋 Enrollment Summary
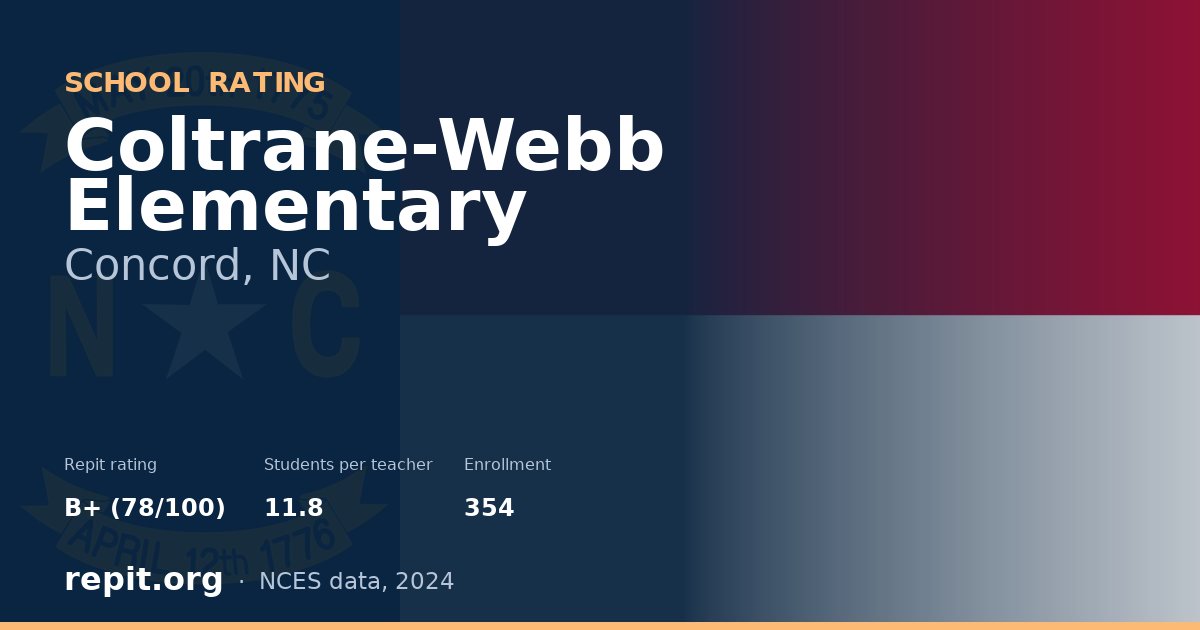
| Total Enrollment | 354 |
| Teachers (FTE) | 30.1 |
| Student:Teacher Ratio | 11.8:1 |
Frequently Asked Questions
What is the Repit School Score for Coltrane-Webb Elementary?
How many students attend Coltrane-Webb Elementary?
What grades does Coltrane-Webb Elementary serve?
How much funding does Coltrane-Webb Elementary receive per student?
Other Schools in 28025
About Repit School Scores
Parents choosing a school deserve to see what it actually delivers. Since October 2026 the Repit School Score is built mainly on results:
- Academics (largest share) — the share of students scoring proficient in reading and math on the state test, ranked against schools of the same level in the same state.
- Graduation (high schools) — the four-year adjusted cohort graduation rate. Only regular diplomas count; GEDs and certificates of attendance do not.
- Resources (smaller share) — class size, per-pupil funding, school size and type.
Scores compare schools within their own state, because every state writes its own tests and sets its own proficiency bar. Full methodology
Data sources: NCES CCD 2024-25, U.S. Dept. of Education EDFacts (test results & graduation) | Last updated: October 2026